Introduction to robvis, a visualisation tool for risk-of-bias assessments
2019-04-18
Source:vignettes/intro-to-robvis.Rmd
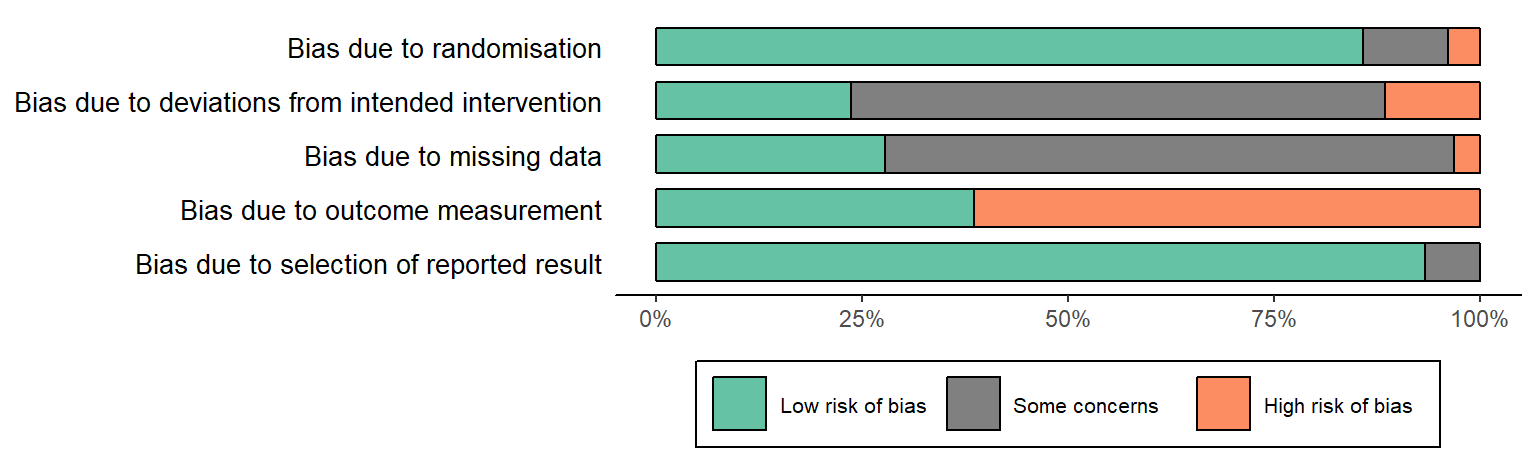
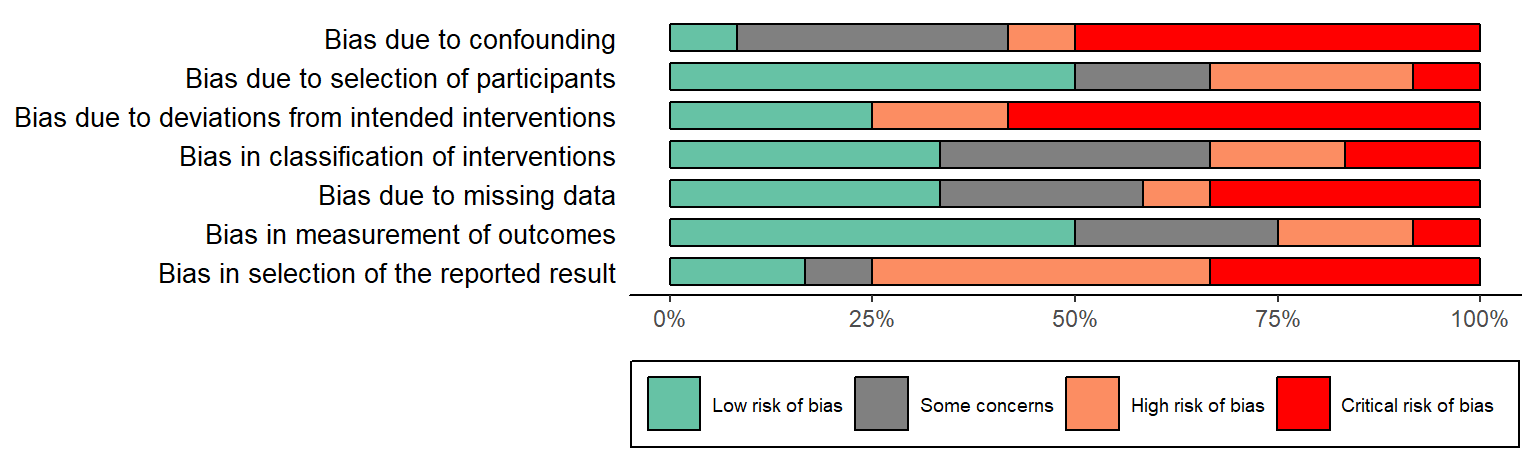
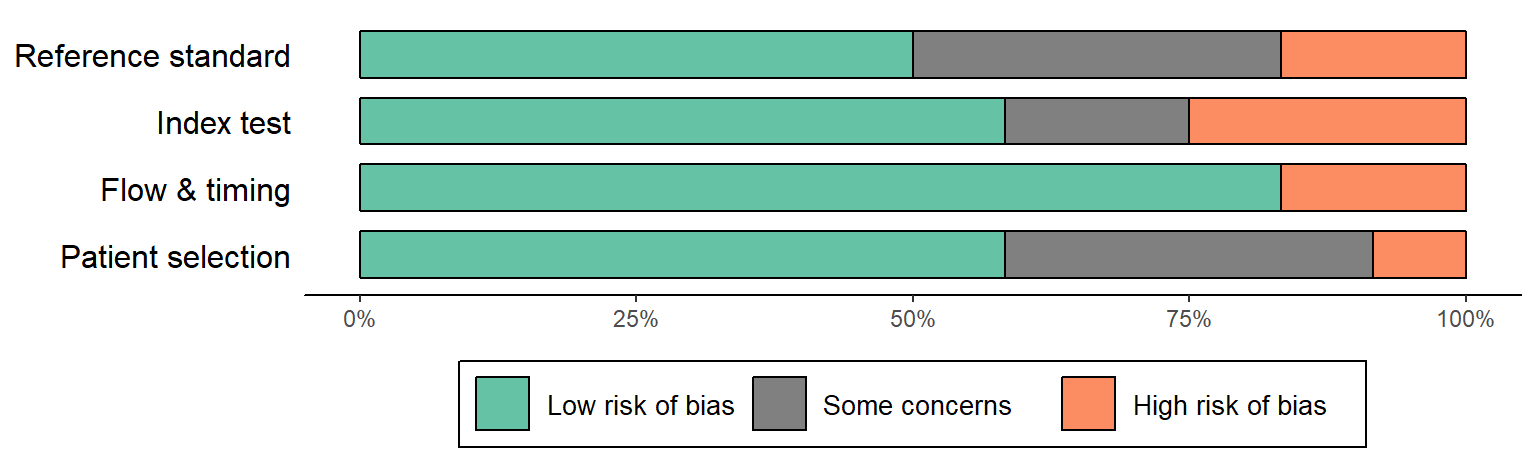
intro-to-robvis.RmdThe robvis package takes the summary table from risk-of-bias assessments, converts it to tidy data, produces a summary plot (incorporating some measure of weighting for each study), and formats the plot by the tool used.
Users can currently produce summary plots for three commonly used tools: ROB2.0, ROBINS-I and QUADAS-2
Common structure of risk-of-bias assessment output (usually in Excel)
knitr::kable(data_rob)| Study | D1 | D2 | D3 | D4 | D5 | Overall | Weight |
|---|---|---|---|---|---|---|---|
| Study 1 | Low | Low | Low | Low | Low | Low | 33.3333333 |
| Study 2 | Some concerns | Low | Low | Low | Low | Low | 33.3333333 |
| Study 3 | Some concerns | Low | Some concerns | Low | Low | Some concerns | 0.1428571 |
| Study 4 | Low | Low | High | Low | Some concerns | High | 9.0909091 |
| Study 5 | High | High | Low | Low | Some concerns | Low | 12.5000000 |
| Study 6 | Low | High | Some concerns | Low | Low | Some concerns | 25.0000000 |
| Study 7 | Low | Some concerns | Some concerns | High | Low | Some concerns | 200.0000000 |
| Study 8 | Low | Some concerns | Low | Low | Low | Low | 11.1111111 |
| Study 9 | Low | Low | High | Low | Low | High | 1.1111111 |